Command Post Home Page : F3
|
|
F3: Command Post Tools
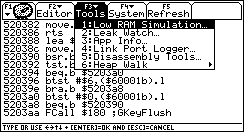
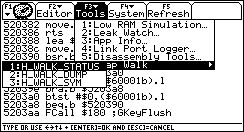
The Tools tool bar menu gives you access to several of the most advanced features
in Command Post. The Low Ram Simulation allows you to test your programs and applications
under extremely low memory conditions. The Leak Watch feature allows you to monitor
your applications so that they do not leak memory. The App Info feature gives detailed
information about the 3rd party apps installed on your calculator, and the Heap
Walk function allows you to "dump" the contents of the heap to the link
port for external debugging.
Low RAM Simulation
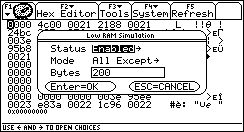
The Low RAM Simulation allows you to test your programs and applications
under low memory conditions. You have two modes of operation available. The All
Except mode uses all available ram except the number of bytes that you specify
in the Bytes edit box. The Use mode uses the number of bytes specified
in the Bytes edit box up to the amount of free memory available.
When the Low RAM Simulation is used from within Command Post, the new settings
will be applied immediately, and when you switch to another application. As a result,
if you specify that the simulation use more ram than Command Post requires, Command
Post will refuse to start.
Tip: If you have trouble using your calculator because of the Low Ram simulation,
using the TI-Basic extension to turn off the low memory simulation is recommended.
Ex: LowMem(0) If the TI-Basic extension fails to work because there is not
enough free RAM, then use the Var-Link to delete the temporary variables created
with the low ram simulation. The variables have this format: lowmemxx where
xx is a hexadecimal number from 0x0 to 0x32.
Leak Watch
The Command Post Leak Watch tool is designed specifically for interactive FLASH
Applications. With it, you can monitor any third party application for possible
memory leaks. Command Post will report any change in the amount of free ram (Delta
RAM) positive or negative. Negative values indicate memory loss, and positive values
indicate a gain in total available memory.
Leak Watch Example 1:
The default template and examples that come with the current beta release of Flash
Studio have some bugs that we need to find. One of those bugs is that the template
does not call the default event handler in its CM_DEACTIVATE event (as of 08/06/2002).
That causes a memory leak because the memory allocated for the application's
toolbar will not be freed! Current versions of Flash Studio have corrected this
bug in the templates.
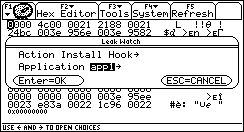
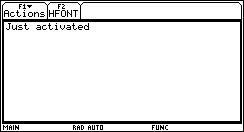
Step 1: Install Leak Watch on the application(s) to monitor. In this example,
we will use app1, which was created from the default FLASH Application template.
 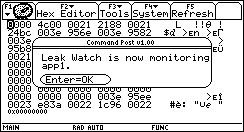
If the leak watch hook installation was successful, Command Post will inform you
(see above picture).
Step 2: start App1 by pressing the APPS key, and running App1.
Step 3: exit App1 by pressing 2nd Quit
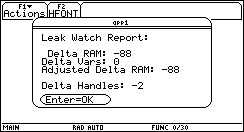
Command Post will inform you of a possible memory leak. In this case, the amount
of lost ram was 88 bytes contained within 2 handles. In this case, one of the handles
is a legitimate memory loss - its not a leak, but some overhead that the OS initializes
on the first run of App1. The second handle that was lost IS a memory leak of exactly
66 bytes. Note: Current versions of Flash Studio have been fixed, and the default
FLASH Application template will not leak memory.
At this point, an explanation of each item in the Leak Watch Report is in order.
- Delta RAM
- This is an overall measure (in bytes) of the amount of ram GAINED or LOSSED while
the App was running interactively.
- Delta Vars
- This number is a representation of the variable table size (reported in
bytes using the HeapSize rom call while scanning each variable that has a
valid handle. Command Post will attempt to determine if files have been added
or removed, and adjust the Adjusted Delta
RAM result accordingly.
- Adjusted Delta RAM
- This number is the amount of RAM GAINED or LOSSED while the
App was active. A negative number indicates a possible memory leak. A positive
number indicates that the amount of free ram before the program was run is
less than the amount of ram after the App has shut down.
- Delta Handles
- This number is the change in the number of handles while the App ran. A
negative number here is a possible memory leak. In any case, it indicates
how many handles your program is freeing or not freeing as the case may be.
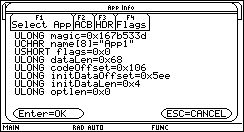
App Info
The App Info feature gives you detailed information about each app installed on
your calculator. You may choose any app on the calculator including built-in OS
'Apps'.
To use the App Info feature, Press F3: 3 App Info.
Next, choose a Flash App.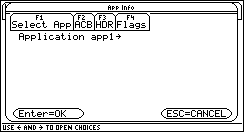
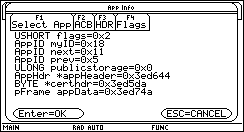
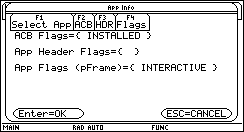
Now with an app selected, you may push F2 to view the App's ACB structure
(ACB), F3 shows the App's Flash Header (AppHdr), and F4 translates
the App Flags found in the ACB and AppHdr data structures into human readable
format.
When you are done with the App Info function, simply press ENTER, or ESC to
dismiss the dialog.
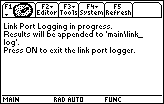
Link
Port Logger
The Link Port Logger is a simple tool which is designed to record data that is
transmitted to the link port. For example, you can use the Link Port Logger to
receive data from the HeapWalk feature or to record the
XML Error Report from a crashed calculator which is
running Command Post.
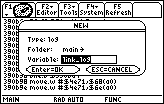 
If you want to convert the link_log variable
to a text variable for viewing
using the Text Editor Application, follow these steps:
Warning: only convert the link_log variable to the TEXT data
type if you know that there is NO binary data in the link_log
variable!
- Launch Command Post and use the Var-Link to jump to the
DATA portion of the
link_log variable.
- Copy Special (size=word)
- Use the edit dialog. Set the Edit Size to Word and
the Mask to None. Paste
the number you copied previously into the edit box.
- Subtract 4 from the number in the edit box. (The edit box should contain text
which looks like this: 756-4)
- Press
 to commit the change. to commit the change.
- Jump to Bookmark #2 you may use the shortcut keys:
 
- Jump To Relative Address -4 (negative
four).
- Edit the byte by replacing the number 6c with E0 .
- At this point, the conversion is complete. The variable should have the type
"TEXT". You may wish to rename the variable because the Command Post link port
logger will
refuse
to
modify
the
link_log
variable if it does not have the type of "LOG"
- Open the variable with the Text Editor.
Disassembly
Tools
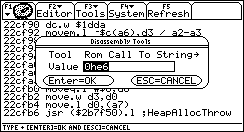
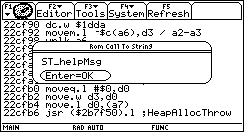
The disassembly tools dialog provides extra support for the disassembler. You
can use the Rom Call To String tool to translate a rom call index to its name when
the rom call database is installed on your calculator. Additionally, you can use
the movem
predecrement and movem postincrement tools
to translate register lists into readable strings such as a0-a6/d0-d7.
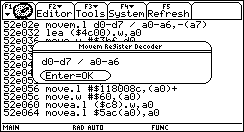
The movem Register Decoder translates values such as 0xFFFE into a register
list for use with the movem mnemonic. This feature
was designed with two purposes in mind. One is to translate register
lists created by the TIGCC compiler
which generates code such as movem.l #0xfffe,-(sp) in source files
generated from C code. The other purpose is to translate movem mnemonics
when Command
Post is running with Verbose Movem turned off.
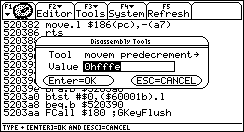 
Note:
Use the predecrement mode for statements
such as movem.l d0-d7/a0-a6,-(a7).
Use the postincrement mode
for statements that follow the format movem.l (a7)+,d0-d7/a0-a6.
Heap Walk
The Heap Walk sub-functions simply call the AMS HeapWalk ROM call with the value
you select. All information is transmitted through the link port. For more information
about the HeapWalk rom call, see the TIGCC
HeapWalk documentation,
or TI's documentation for their SDK.
You
may use Command Post's Link Port Logger feature,
LinkNLog (works
with Black, Gray, and USB cables), or a gray graphlink cable connected to
a computer which is running a program such as HyperTerminal
with the following settings: Bits Per Second 9600, Data Bits 8,
Parity None,
Stop Bits 1, Flow Control Hardware.
|